How to add the Highcharts Editor to Sanity, or how to insert an octagon shaped block into a hexagon shaped slot?
It ended up being a tough feat to pull off, but I finally managed to embed the Highcharts Editor into Sanity’s Content Studio.
🎉

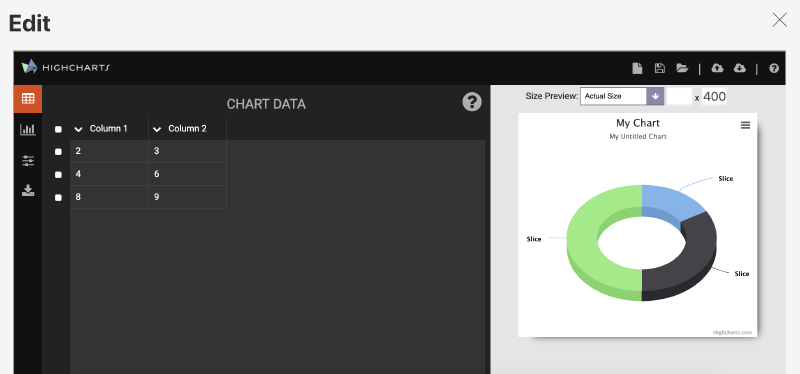
Doughnouts are the way to go.
To supercharge your Sanity you can now grab this plugin:
✨ sanity-plugin-highcharts-editor ✨
The backstory: Why the <iframe/> element is an unsung hero #
At Netlife we do work for the U4 Anti-Corruption Resource Centre. They needed better functionality for handling charts, and together we set our eyes on adding Highcharts to their existing Sanity setup.
Based on the Highcharts Editor’s homepage, impressive examples and documentation it looked to be fairly straightforward to add Highcharts to Sanity.
But there were some rough edges. Not because Sanity or Highcharts were poorly built, just because they were different enough. On one hand you have Highcharts.js which relies on being “globally” loaded. On the other hand you have Sanity which doesn’t let you mess with the build scripts in order to load scripts globally.
This had me stumped for a bit, and then I remembered the humble iframe.
Some years back I did a ton of iframe shenanigans when I built this Chrome extension Tag You’re It. Now it was time to brush some dust of that knowledge.
I downloaded the standalone version of the Highcharts Editor which was built around a regular .html file which loads the javascript and css it needs. I put that html file inside Sanity’s /static/ folder which is meant for serving up static assets. Inside my custom component I then created an iframe, and set its src attribute to load the locally served html file. This proved it was possible to load the editor this way, but my custom component was not yet able to interact with the loaded editor.
I had to do some more wrangling to get hold of the editor instance inside the iframe. I couldn’t just attach a onload attribute to the iframe because it would fire too soon, before the editor instance would be loaded. So, I created a setup where the html file would start polling for a globally present variable within the iframe.
Outside of the iframe, within my custom component I would then add a callback to the iframe with iframe.contentWindow. Once the polling function inside the iframe spots the callback it instantiates the editor and calls the callback with a reference to the editor.

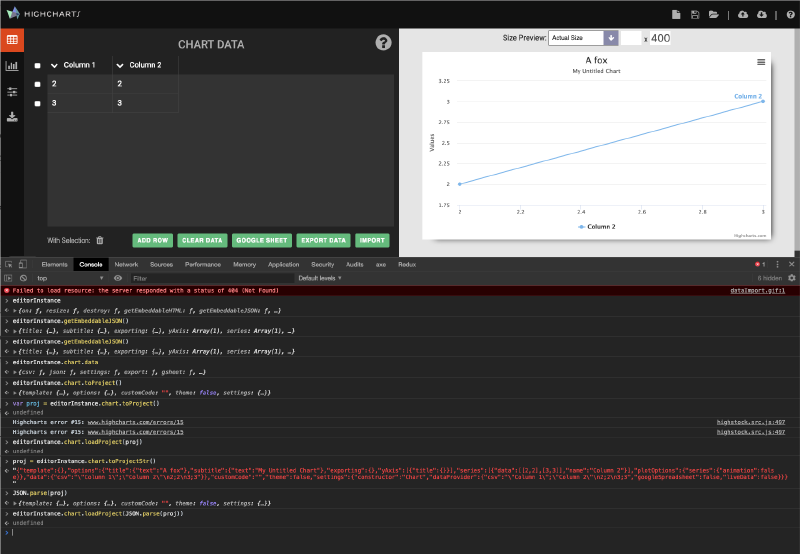
“Use the debugger Luke.” Here’s me poking at the editor instance.
Now I had contact with the editor running inside the iframe. But I found that there were no clear documentation on how to save or load the editor data. I set a debugger break point in my javascript code and started to explore what functions were present on the instantiated editor. I quickly found some useful APIs like:
editor.getEmbeddableSVG()editor.getEmbeddableHTML()editor.getEmbeddableJSON()
All these APIs returned data for building the graph with either html, svg or json. But there were still some issues. The json string was missing data, and the svg was distorted.
I solved the json issue by dynamically exploring the editor object, calling various properties on it until I saw that editor.chart.options.full returned the json data I needed to properly build the graph.
The distorted svg was a weird bug. When I manually clicked “svg export” in the editor the resulting svg would look fine, but not when automatically saved on closing the editor. I hypothesized that the closing modal was resizing the iframe and I was calling export too late causing the distorted svg. I was able to fix that by periodically exporting copies of svg and html data into local state and just saving that data when the user presses the close button.
Beyond the chart data I also had to solve how to save or load Highcharts Editor configuration data. There wasn’t any documentation on that, but thankfully I found one comment in one issue that mentioned the function calls I should use. I must add that Highcharts has a lot of documentation in general, just not this Highcharts Editor.
Finally I had the means to export graphs and to save and load the whole editor setup. This was the final issue, the final stone in the wall. At least for now this implementation seems to be stable. It will be exciting to see how it performs when pushed with a lot of data.
Programming is to make things work within a messy world #
I hope I was able to share how explorative programming can be. Tutorials and guides can trick you into thinking that programming is mostly a straightforward procedure, when often it isn’t. And think this episode of Fun Fun Function captured some good thoughts on that distinction.
Get in touch if you’re curious about what it’s like to work at Netlife. Definitely give me a shoutout if you use this plugin for some awesomeness.
🚀❤️⚗️
 Nils Norman Haukås